Venn Diagram Examples And Word Problems, Explained
The short version
- A Venn diagram uses overlapping circles to sort things into groups. The overlap holds items that belong to both groups, and the space outside every circle holds items that belong to none.
- For two groups, the total in at least one circle is A + B – both. You subtract the overlap because it got counted twice.
- Fill in word problems from the middle out: overlap first, then the “only” parts, then the “neither” count outside the circles.
- Three circle problems work the same way. Start with the center region that’s in all three, then the three pairwise overlaps, then the single circles.
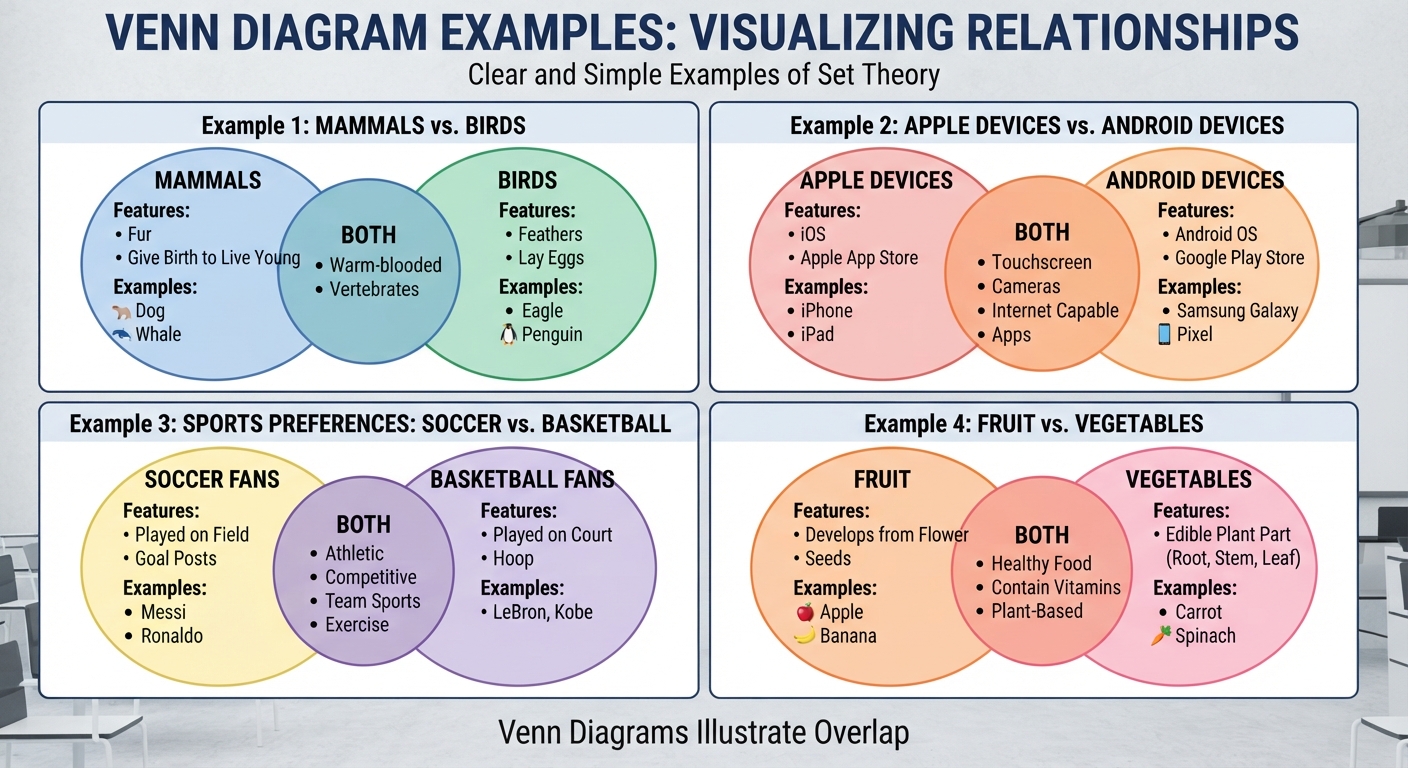
A Venn diagram is a picture of groups drawn as overlapping circles inside a rectangle. Each circle is one group, the overlap shows what the groups share, and anything outside the circles belongs to none of them. The Venn diagram examples below start with simple sorting and build to two and three circle word problems, all with the numbers worked out.
Kids meet them in early elementary as a compare and contrast tool, then again in middle school counting problems and high school probability. Only the numbers get harder.
The parts of a Venn diagram
Every two circle Venn diagram has four regions. Once your child can name them, most problems turn into careful bookkeeping.
| Region | What it holds | Set notation |
|---|---|---|
| Left circle only | In A but not in B | A only |
| Overlap (middle) | In both A and B | A ∩ B (intersection) |
| Right circle only | In B but not in A | B only |
| Outside both circles | In neither group | Neither |
Two more words show up in textbooks. The intersection (∩) is just the overlap. The union (∪) is everything inside either circle, overlap included. The rectangle around the circles is the universal set, meaning everything being sorted.
Venn diagram examples with lists
Before any counting, kids sort actual items. Younger grades do this with words (frog vs. fish, what’s the same goes in the middle). Older grades sort numbers.
Example 1: sorting numbers
Sort the whole numbers 1 through 12. Circle A is “even numbers.” Circle B is “multiples of 3.”
A = {2, 4, 6, 8, 10, 12}
B = {3, 6, 9, 12}
Both (overlap): {6, 12}
A only: {2, 4, 8, 10}
B only: {3, 9}
Neither: {1, 5, 7, 11}
Quick check: 4 + 2 + 2 + 4 = 12, which matches the 12 numbers we started with. That habit of adding every region back up catches most errors.
Two circle Venn diagram word problems
This is where most homework questions come from. The problem gives totals, and your child has to split them into regions.
Example 2: find the “only” regions
In a class of 30 kids, 18 play soccer, 12 play basketball, and 5 play both. How many play only soccer, only basketball, and neither?
Step 1, overlap: 5 play both.
Step 2, soccer only: 18 – 5 = 13
Step 3, basketball only: 12 – 5 = 7
Step 4, in at least one circle: 13 + 5 + 7 = 25
Step 5, neither: 30 – 25 = 5
Check: 13 + 5 + 7 + 5 = 30. Every kid is counted exactly once.
Example 3: find the overlap
Some problems hide the overlap. Of 40 students, 25 take Spanish, 20 take art, and 8 take neither. How many take both?
Step 1, students in at least one class: 40 – 8 = 32
Step 2, Spanish + art counts: 25 + 20 = 45
Step 3, the extra is the double count: 45 – 32 = 13 take both
Step 4, Spanish only: 25 – 13 = 12. Art only: 20 – 13 = 7.
Check: 12 + 13 + 7 + 8 = 40.
The Venn diagram formula
Example 3 used the formula without naming it:
n(A ∪ B) = n(A) + n(B) – n(A ∩ B)
In plain words: the number in at least one group equals group A plus group B minus the overlap. You subtract the overlap because the kids in it were counted once with A and again with B. The formula has four pieces, so if a problem gives you any three, you can find the fourth.
In Example 3: 32 = 25 + 20 – both, so both = 45 – 32 = 13.
Three circle Venn diagram examples
A three circle diagram has eight regions: the center (all three), three “exactly two” regions, three “only one” regions, and the outside. The rule that saves kids here is simple. Always fill the center first and work outward.
Example 4: pets survey
50 students were asked about pets. 28 have a dog, 20 have a cat, 12 have fish. 10 have a dog and a cat, 6 have a dog and fish, 5 have a cat and fish, and 3 have all three. How many have none of these pets?
Step 1, center (all three): 3
Step 2, dog and cat only: 10 – 3 = 7
Dog and fish only: 6 – 3 = 3
Cat and fish only: 5 – 3 = 2
Step 3, dog only: 28 – 7 – 3 – 3 = 15
Cat only: 20 – 7 – 2 – 3 = 8
Fish only: 12 – 3 – 2 – 3 = 4
Step 4, inside any circle: 15 + 8 + 4 + 7 + 3 + 2 + 3 = 42
Step 5, none: 50 – 42 = 8
| Region | Count |
|---|---|
| Dog only | 15 |
| Cat only | 8 |
| Fish only | 4 |
| Dog and cat only | 7 |
| Dog and fish only | 3 |
| Cat and fish only | 2 |
| All three | 3 |
| None | 8 |
| Total | 50 |
The three set formula gives the same 42: n(A ∪ B ∪ C) = 28 + 20 + 12 – 10 – 6 – 5 + 3 = 42. You add the singles, subtract the pairs, then add the center back because subtracting the pairs removed it too many times.
Common mistakes with Venn diagrams
- Writing the total in the “only” region. If 18 kids play soccer and 5 play both, the soccer only region is 13, not 18. The 18 covers the whole soccer circle.
- Forgetting the outside. Kids who skip the “neither” region end up with totals that don’t match the problem.
- Adding A + B and calling it the total. That counts the overlap twice. In Example 2, 18 + 12 = 30 looks like the class size, but only 25 kids play a sport.
- Filling a three circle diagram from the outside in. “10 have a dog and a cat” includes the 3 with all three pets. Start at the center or every region after it will be off.
- Skipping the check. Adding every region back up takes 20 seconds and catches almost every error.
Practice problems
- In a group of 20 kids, 12 like apples, 9 like bananas, and 4 like both. How many like only apples? Only bananas? Neither?
- A = {1, 2, 3, 4, 5, 6} and B = {2, 4, 6, 8, 10}. List A ∩ B and A ∪ B.
- Of 35 families, 22 own a car, 15 own a bike, and 6 own neither. How many own both?
- Sort the numbers 1 through 20. Circle A is multiples of 2 and circle B is multiples of 3. How many numbers land in the overlap? How many land outside both circles?
- In a Venn diagram, the “A only” region is 14, the overlap is 6, and n(B) = 15. Find n(A ∪ B).
- 60 students were surveyed. 25 are in math club, 22 in science club, 18 in art club. 10 are in math and science, 7 in math and art, 6 in science and art, and 4 are in all three. How many are in only math club? How many are in no club?
Answers
- Only apples: 12 – 4 = 8. Only bananas: 9 – 4 = 5. Neither: 20 – (8 + 4 + 5) = 3.
- A ∩ B = {2, 4, 6}. A ∪ B = {1, 2, 3, 4, 5, 6, 8, 10}.
- At least one: 35 – 6 = 29. Both: 22 + 15 – 29 = 8.
- Multiples of 2: 10. Multiples of 3: 6. Overlap (multiples of 6): 6, 12, 18, so 3. Outside: 20 – (10 + 6 – 3) = 7. Those are 1, 5, 7, 11, 13, 17, 19.
- B only = 15 – 6 = 9. n(A ∪ B) = 14 + 6 + 9 = 29.
- Math and science only: 10 – 4 = 6. Math and art only: 7 – 4 = 3. Only math: 25 – 6 – 3 – 4 = 12. In at least one club: 25 + 22 + 18 – 10 – 7 – 6 + 4 = 46. No club: 60 – 46 = 14.
If your child is stuck on Venn diagrams
A kid who draws the circles fine but gets the wrong numbers usually has a gap in one of two earlier skills. The first is part and whole thinking with subtraction: knowing that if 18 is the whole circle and 5 is one part, the other part is 18 – 5. That’s a second and third grade idea, and you can see where it sits in our guide to math skills by grade level.
The second is reading a word problem closely enough to tell “play soccer” from “play only soccer.” If your child is rushing, guessing, or freezing on multi-step word problems in general, check the signs a child is behind in math. A short math assessment can tell you which of those two it is, so practice goes to the right place.
Frequently asked questions
What is a Venn diagram used for?
It sorts things into groups and shows what the groups share. In school it’s used for compare and contrast writing, sorting numbers by rules, solving counting word problems, and later for probability and set theory.
What does the middle of a Venn diagram mean?
The middle, where the circles overlap, holds everything that belongs to both groups at once. In set language it’s called the intersection and written A ∩ B.
How do you solve a Venn diagram word problem?
Draw the circles and a rectangle around them. Fill in the overlap first, subtract it from each circle’s total to get the “only” regions, then subtract everything inside the circles from the grand total to get the outside. Add all regions to check.
How many circles can a Venn diagram have?
Two and three circles are standard in school. Diagrams with four or more groups exist, but they need ovals or odd shapes so every combination gets its own region, and they get hard to read fast.
What’s the difference between union and intersection?
The intersection is only the overlap: items in both groups. The union is everything in either group, overlap included. In Example 2, the intersection is 5 kids and the union is 25 kids.
Find the actual gap
When a Venn diagram problem goes wrong, the fix depends on why. Math Anon starts with a short adaptive assessment that pinpoints which earlier skills are missing and sends you a written report, so you know whether it’s subtraction, reading the problem, or something else.
From there your child gets about 20 minutes a day of practice aimed at those exact gaps, and you get a progress report every week. Start the assessment for $49, which is credited back in full on your first month. Details are on our pricing page.