Line Plot: How To Read One And Make One
The short version
- A line plot stacks X marks (or dots) above a number line to show how many times each value shows up in a data set.
- To read one, find the value on the number line, then count the X marks stacked above it. That count is the frequency.
- To make one, draw a number line from the smallest value to the largest with even spacing, then stack one mark per data point.
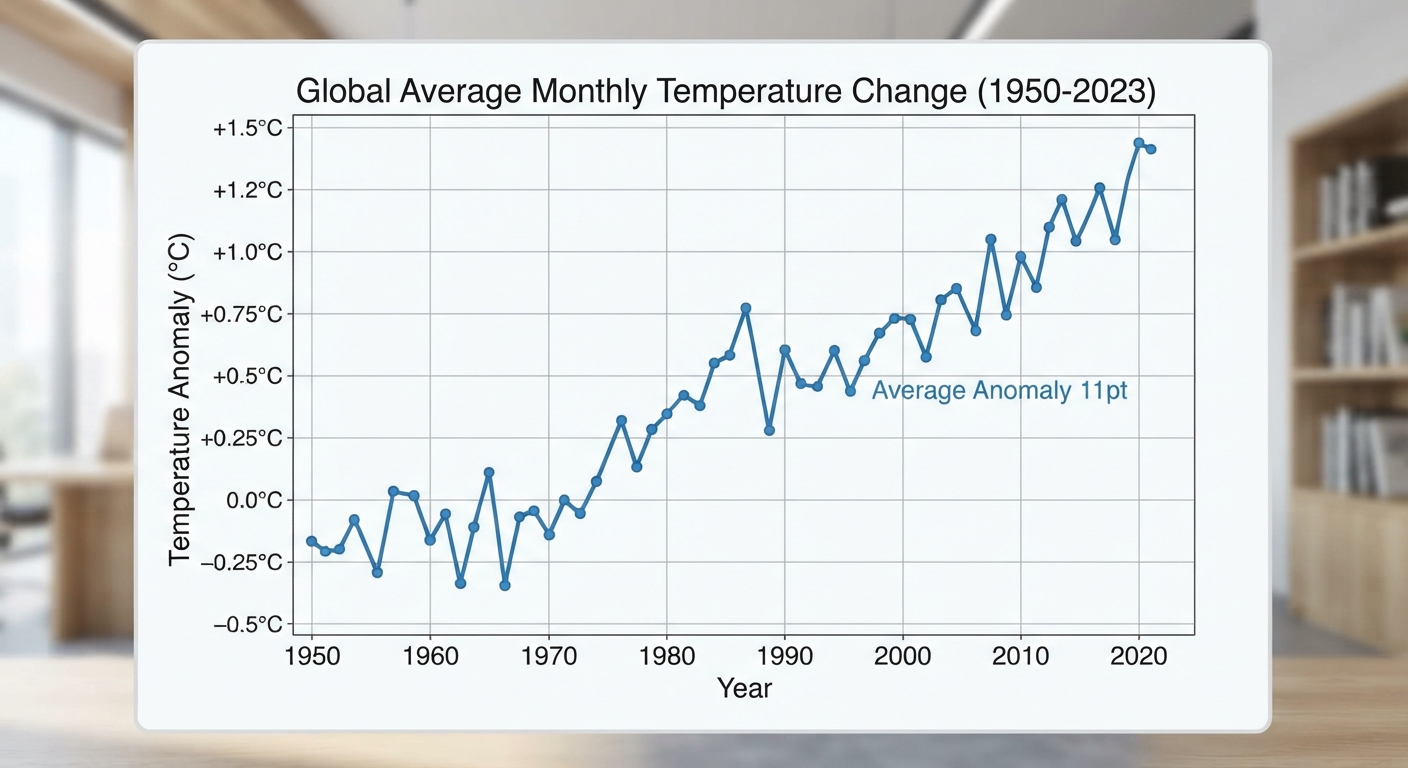
- A line plot is not a line graph. A line graph connects points to show change over time. A line plot shows how often each value appears.
A line plot is a graph that shows data along a number line, with one X (or dot) stacked above a value each time that value appears. Count a stack and you know its frequency. Look at where the stacks pile up and you can see the mode, the spread, and any values sitting off alone.
Teachers sometimes call the same picture a dot plot. It’s the same graph with dots instead of X marks, and both names show up on worksheets.
What a line plot is made of
A finished line plot has four parts: a title, a number line running from the smallest value to the largest, labels under the ticks with the unit, and one X mark per data point.
Two rules matter most. Tick marks have to be evenly spaced, even at values nobody picked, and every X has to be the same size so the stacks stay comparable at a glance.
How to read a line plot
Here are answers from 18 students asked how many pets they have. On paper the X marks sit above a number line from 0 to 5. Written out, the stacks look like this.
| Pets | X marks | Number of students |
|---|---|---|
| 0 | XXX | 3 |
| 1 | XXXXXX | 6 |
| 2 | XXXXX | 5 |
| 3 | XX | 2 |
| 4 | X | 1 |
| 5 | X | 1 |
How many students answered? Add every X mark, not every column.
3 + 6 + 5 + 2 + 1 + 1 = 18 students.
What’s the mode? The tallest stack sits above 1, so the mode is 1 pet. The answer is the value on the number line, not the height of the stack. Writing 6 here is the most common mistake on this kind of question.
What’s the range? Largest value minus smallest value.
5 – 0 = 5.
How many pets in all? Multiply each value by its frequency, then add.
0 × 3 = 0
1 × 6 = 6
2 × 5 = 10
3 × 2 = 6
4 × 1 = 4
5 × 1 = 5
0 + 6 + 10 + 6 + 4 + 5 = 31 pets.
What’s the mean? Total pets divided by number of students.
31 ÷ 18 = 1.72…, so about 1.7 pets per student.
What’s the median? With 18 values, the middle sits between the 9th and 10th. Counting marks from the left, marks 1 to 3 are 0 and marks 4 to 9 are 1, so the 9th value is 1 and the 10th is 2.
(1 + 2) ÷ 2 = 1.5 pets.
How to make a line plot step by step
A student asks 12 classmates how many books they finished last month and gets these answers: 2, 4, 3, 2, 5, 3, 3, 1, 4, 3, 2, 6.
Step 1. Find the smallest and largest value. The smallest is 1 and the largest is 6.
Step 2. Draw the number line. Mark every whole number from 1 to 6 with equal gaps. Do not skip 5 just because nobody said 5.
Step 3. Go through the data in order and mark one X per answer. Cross each number off the list as you plot it. That habit keeps the counts honest.
Step 4. Check your total. Count the X marks. You should get 12, the number of classmates asked.
Step 5. Add a title and a label. Title it “Books Finished Last Month” and label the number line “Number of books.”
The finished plot has 1 X above 1, 3 above 2, 4 above 3, 2 above 4, 1 above 5, and 1 above 6. Total: 1 + 3 + 4 + 2 + 1 + 1 = 12. The mode is 3 books.
Line plot vs line graph vs bar graph
These get mixed up constantly, which costs points on test questions asking which graph fits a situation. A line plot counts repeats, a line graph tracks change over time, a bar graph compares categories.
| Graph | What it shows | Good for |
|---|---|---|
| Line plot (dot plot) | How often each number appears, stacked over a number line | Shoe sizes in a class, measurements to the nearest fourth inch |
| Line graph | How one value changes over time, with points joined by segments | Daily temperature for a week |
| Bar graph | Amounts for separate categories, shown as bars with gaps between them | Favorite fruit, votes per candidate |
One clue works almost every time. If the horizontal axis holds numbers and each data point is one mark, it’s a line plot. If it holds words like “apple” and “banana,” it’s a bar graph.
Line plots with fractions
In fourth and fifth grade, a line plot stops being about counting pets and starts being about measurement. Students measure to the nearest half, fourth or eighth of an inch, plot the results, then answer questions that need fraction arithmetic.
Here are 12 bean sprouts measured to the nearest fourth of an inch.
| Height in inches | X marks | Number of sprouts |
|---|---|---|
| 2 | X | 1 |
| 2 1/4 | XXX | 3 |
| 2 1/2 | XXXX | 4 |
| 2 3/4 | XX | 2 |
| 3 | XX | 2 |
How much taller is the tallest sprout than the shortest?
3 – 2 = 1 inch.
How many sprouts are at least 2 1/2 inches tall? Add the stacks at 2 1/2 and above.
4 + 2 + 2 = 8 sprouts.
Stack the four sprouts that measure 2 1/2 inches end to end. How tall is the stack?
4 × 2 1/2 = 4 × 5/2 = 20/2 = 10 inches.
Every fourth still gets a tick: 2, 2 1/4, 2 1/2, 2 3/4, 3. Kids who label only the values they measured end up with a squished, misleading plot.
Common mistakes on line plots
Answering with the stack height instead of the value. “What number of pets was most common?” wants 1, not 6. Read the number line, not the pile.
Skipping values with zero marks. If no one scored 3, the 3 still belongs on the number line with an empty space above it. That empty space is data.
Confusing mode and median. The mode is the value with the tallest stack. The median is the value in the middle once every single mark is counted in order from left to right.
Practice problems
Problems 1 to 6 use this line plot of goals scored by a soccer team over 15 games.
| Goals | X marks | Games |
|---|---|---|
| 0 | XX | 2 |
| 1 | XXXX | 4 |
| 2 | XXXXX | 5 |
| 3 | XXX | 3 |
| 4 | X | 1 |
- How many games are shown on the line plot?
- What number of goals was most common?
- In how many games did the team score at least 2 goals?
- What is the range of the data?
- How many goals did the team score in all 15 games?
- What is the mean number of goals per game, rounded to the nearest tenth?
Problems 7 and 8 use this line plot of ribbon lengths, measured to the nearest half inch.
| Length in inches | X marks | Ribbons |
|---|---|---|
| 3 | XX | 2 |
| 3 1/2 | XXX | 3 |
| 4 | XXXX | 4 |
| 4 1/2 | X | 1 |
- How much longer is the longest ribbon than the shortest ribbon?
- What is the combined length of all the ribbons that measure 4 inches?
Answers
1. 15 games. 2 + 4 + 5 + 3 + 1 = 15.
2. 2 goals. That stack has 5 X marks, the tallest on the plot.
3. 9 games. “At least 2” covers 2, 3 and 4, so 5 + 3 + 1 = 9.
4. 4, because 4 – 0 = 4.
5. 27 goals. (0 × 2) + (1 × 4) + (2 × 5) + (3 × 3) + (4 × 1) = 0 + 4 + 10 + 9 + 4 = 27.
6. 1.8 goals per game. 27 ÷ 15 = 1.8 exactly.
7. 1 1/2 inches, since 4 1/2 – 3 = 1 1/2.
8. 16 inches, since 4 × 4 = 16.
What it means if your child is stuck on line plots
Line plots are rarely the real problem. The graph itself takes about ten minutes to teach. When a kid stalls on line plot homework, the missing piece sits underneath it: reading a number line where the ticks are fractions, or knowing what “at least” and “fewer than” mean in a question. Fix the number line and the graph questions fix themselves.
The fraction version trips up more kids, for a predictable reason. Plotting 2 3/4 means seeing that the space between 2 and 3 splits into four equal pieces. A child who thinks of fractions only as pizza slices has nothing to hang that on. If that sounds familiar, the pattern in Struggling With Algebra? The Real Problem Is Usually Fourth Grade Fractions shows up years before algebra does.
It also helps to know what’s expected at each grade before deciding something is wrong. Math Skills By Grade Level: What Your Child Should Know lays out where data and measurement sit in third through fifth grade, and Is My Child Behind In Math? 12 Signs By Grade Level covers the warning signs.
Frequently asked questions
What is a line plot in math?
A line plot is a graph that shows data along a number line, using one X or dot above a value for each time that value appears in the data set. The height of each stack tells you the frequency of that value.
Is a dot plot the same as a line plot?
Yes. A dot plot is a line plot drawn with dots instead of X marks. Elementary curricula say line plot and statistics courses say dot plot, but the graph is identical.
What’s the difference between a line plot and a line graph?
A line plot stacks marks over a number line to show how often each value occurs. A line graph plots points and connects them with segments to show how something changes over time. If the answer involves time on the horizontal axis, you want a line graph.
What grade do students learn line plots?
Most students meet their first line plot in second grade with whole numbers, build on it in third grade, then work with halves, fourths and eighths in fourth and fifth grade.
How do you find the mean from a line plot?
Multiply each value by the number of marks above it, add the products, then divide by the total number of marks. In the pets example, 31 ÷ 18 = about 1.7.
Find the actual gap
Guessing which skill is missing wastes weeks. Math Anon starts every student with a short adaptive assessment that adjusts as they answer, then gives you a written report naming the skills that aren’t solid, from reading a fraction number line to something two grades back. Start the assessment and you’ll know what you’re dealing with.
After that it’s about 20 minutes of targeted daily practice aimed at those exact gaps, with a progress report in your inbox each week. The assessment costs $49 and we credit all of it back on your first month. Details are on our pricing page, and Mind The Gap: A Parent’s Guide To Math Assessment For Kids walks through how an assessment works.