Types Of Graphs In Math: Which One To Use When
The short version
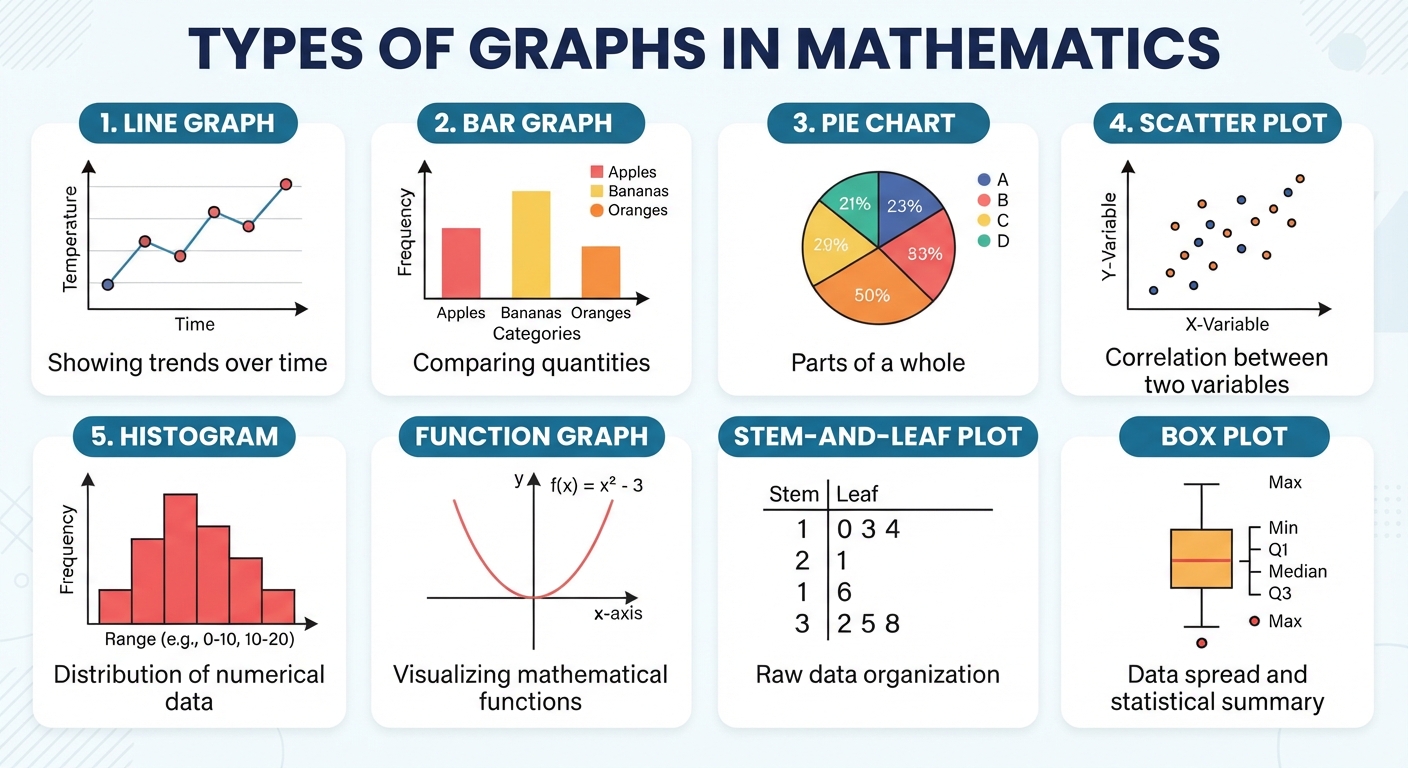
- The six types of graphs kids meet in school are bar graphs, line graphs, pictographs, circle graphs, histograms and scatter plots.
- Pick by the question you’re answering. Comparing separate groups is a bar graph. Tracking change over time is a line graph. Showing parts of one whole is a circle graph.
- Bar graphs and histograms look alike but aren’t. Bar graphs compare categories and have gaps between bars. Histograms show number ranges and the bars touch.
- Every graph needs a title, labeled axes, and a scale that starts at zero. Most “misleading graph” questions on tests come down to one of those being off.
- Scatter plots are the only one of these built to show whether two things are related, which is why they turn up again in algebra and statistics.
The main types of graphs are bar graphs, line graphs, pictographs, circle graphs, histograms and scatter plots. Each one exists because it answers a different question about data, and picking the wrong one is the fastest way to make a clear set of numbers look confusing.
Here’s what each type shows, how to read it, and a short decision rule for choosing between them. Worked examples and practice with answers are further down.
The main types of graphs at a glance
| Graph | Best for | Example |
|---|---|---|
| Bar graph | Comparing separate categories | Books read by each of 5 kids |
| Line graph | Change over time | Daily high temperature for a month |
| Pictograph | Simple counts for young readers | Votes shown as stars |
| Circle graph | Parts of one whole | How a class spends 24 hours |
| Histogram | How numeric data spreads out | Test scores grouped 60 to 69, 70 to 79 |
| Scatter plot | Whether two things are related | Study time against test score |
Bar graphs
Bars, drawn with gaps between them, whose heights show amounts for separate categories. The categories can be anything: pets, colors, months, kids’ names. Order them however makes sense, since moving the bars around doesn’t change what the graph says.
Read one by finding the top of the bar and tracking left to the scale. If the scale counts by 5s, a bar halfway between 20 and 25 means about 22 or 23.
Line graphs
Points connected by line segments, with time almost always running along the bottom. The slope of the line is the point: rising means increasing, falling means decreasing, flat means no change. A line graph only makes sense when the horizontal axis has a natural order, which is why you’d never use one for favorite colors.
Pictographs
Counts shown as repeated pictures, with a key saying what one picture is worth. If the key says one star equals 4 votes, then 6 stars is 24 votes, and half a star is 2.
The key is where kids lose points. They count 6 stars and write 6. Always read the key first, then multiply.
Circle graphs
Also called pie charts. The whole circle is 100% of something, and each slice is a share of it. Use one only when the parts really do add to a single whole.
Worked example. Twenty kids pick a favorite fruit: 8 apples, 6 bananas, 4 oranges, 2 grapes.
| Fruit | Count | Fraction | Percent | Slice angle |
|---|---|---|---|---|
| Apples | 8 | 8/20 | 40% | 144° |
| Bananas | 6 | 6/20 | 30% | 108° |
| Oranges | 4 | 4/20 | 20% | 72° |
| Grapes | 2 | 2/20 | 10% | 36° |
The angle comes from the fraction times 360. For apples: 8 ÷ 20 = 0.4, and 0.4 × 360 = 144°. Check your work by adding the angles. They have to hit 360: 144 + 108 + 72 + 36 = 360.
Histograms
Bars showing how many values fall into each range, called a bin. Sixty test scores might be grouped as 60 to 69, 70 to 79, 80 to 89 and 90 to 100. The bars touch because the ranges touch, and you can’t reorder them, since the numbers along the bottom have to stay in order.
Scatter plots
One dot per subject, placed by two measurements at once. Twenty students, each plotted by hours studied and test score, gives twenty dots. If the cloud of dots drifts up to the right, the two things tend to rise together. If it drifts down, one rises as the other falls. If it’s a shapeless blob, there’s no clear relationship.
Bar graph or histogram?
| Question | Bar graph | Histogram |
|---|---|---|
| What’s on the bottom axis? | Categories like colors or names | Number ranges like 10 to 19 |
| Do the bars touch? | No, there are gaps | Yes |
| Can you reorder the bars? | Yes | No |
How to pick the right graph
Ask what the data is doing, not what looks nicest.
- Comparing amounts across separate groups: bar graph.
- Following one thing as time passes: line graph.
- Splitting a single total into shares: circle graph.
- Seeing the shape of a pile of numbers: histogram.
- Testing whether two measurements move together: scatter plot.
- Young kids, small counts, whole numbers: pictograph.
Common mistakes
- Ignoring the pictograph key. Six symbols at 4 each is 24, not 6.
- A scale that doesn’t start at zero. Starting the axis at 80 makes a 3 point difference look enormous. Tests love asking about this.
- Uneven intervals. If the scale jumps 0, 5, 10, 25, 50, the graph lies about the spacing even if every bar is accurate.
- Using a circle graph for things that don’t add to one whole. Favorite sports of kids who can pick more than one won’t total 100%.
- Connecting the dots on a category graph. A line between “dogs” and “cats” means nothing, because there’s no in between.
- Leaving off the title or axis labels. On most rubrics that’s an automatic deduction no matter how accurate the bars are.
Practice problems
- You want to show how tall one plant grew each week for 8 weeks. Which graph?
- You want to compare how many books each of 5 kids read this month. Which graph?
- A pictograph key says one star = 4 votes. How many votes do 6 stars and a half star show?
- Out of 50 students, 15 chose soccer. What percent is that, and how many degrees would that slice be on a circle graph?
- You have the ages of 60 people and want to see how they’re spread across 0 to 9, 10 to 19, 20 to 29 and so on. Which graph?
- You have hours of sleep and test scores for 20 students and want to know if they’re related. Which graph?
- A bar graph’s vertical axis starts at 80 instead of 0. Why does that matter?
- On a circle graph, one slice measures 90°. What percent of the whole is it?
Answers
- Line graph, because it’s one thing changing over time
- Bar graph, because the kids are separate categories
- 6.5 × 4 = 26 votes
- 15 ÷ 50 = 0.30, so 30%. The angle is 0.30 × 360 = 108°
- Histogram, since the data is numeric and grouped into ranges
- Scatter plot, since you’re comparing two measurements for each student
- It exaggerates the differences. Small gaps look huge because the bottom of every bar is cut off
- 90 ÷ 360 = 0.25, so 25%
What it means if your kid is stuck on graphs
Graph units look easy on the surface, so parents are often surprised when they go badly. The trouble is that graphs quietly pull in several other skills at once. Reading a scale that counts by 5s or 25s needs solid skip counting and estimation. Circle graphs need fractions, percents and decimals working together. Histograms need a kid to sort numbers into ranges without dropping any.
Watch where the errors land. If your kid names the right graph type every time but misreads the values off the axis, the problem is the number line, not the graphs. If they can read any graph you hand them but can’t build one, it’s usually scale and interval choice, which is really division. Our breakdown of Math Skills By Grade Level: What Your Child Should Know shows where each of those is supposed to land, and Is My Child Behind In Math? 12 Signs By Grade Level covers the signals that one of them never stuck. Gaps in fractions and percents are also the ones that show up again years later, as we describe in Struggling With Algebra? The Real Problem Is Usually Fourth Grade Fractions.
Frequently asked questions
What are the main types of graphs in math?
Bar graphs, line graphs, pictographs, circle graphs, histograms and scatter plots cover almost everything taught from first grade through middle school. Box plots and stem and leaf plots show up later in statistics.
What’s the difference between a graph and a chart?
In everyday use they mean the same thing. In math class, “graph” usually implies plotted data or a plotted equation, while “chart” is the looser word people use for any data picture, including tables.
Which graph should I use for my data?
Match it to the question. Comparing groups means a bar graph, tracking time means a line graph, shares of a total mean a circle graph, and checking whether two variables move together means a scatter plot.
What’s the difference between a line graph and a line plot?
A line graph connects points to show change over time. A line plot stacks X marks or dots above a number line to show how often each value appears, so it’s closer to a histogram than to a line graph.
What grade do kids learn about graphs?
Pictographs and simple bar graphs start in first and second grade. Line graphs and scaled bar graphs come in third through fifth. Circle graphs, histograms and scatter plots are mostly sixth grade and up.
Why does a scale that skips zero make a graph misleading?
Because bar height is supposed to represent amount. Cut off the bottom of every bar and a tiny real difference can look like a landslide, even though every number on the graph is technically correct.
Find the actual gap
When graph problems fall apart, the cause is usually a skill underneath them, and guessing which one costs weeks. Math Anon begins with a short adaptive assessment that finds the missing pieces, then hands you a written report in plain language explaining what’s actually going on.
Then it’s about 20 minutes a day of practice aimed straight at those gaps, and a progress report every week so nothing stays a mystery. The assessment is $49, credited back in full on your first month. Start the assessment or read the pricing page.